
University Access Dashboard - History
History of the University Access Dashboard
For over a decade, the UAEM Report Card has been measuring universities’ commitments to biomedical research and development that meets the needs of people worldwide.
OUR MISSION
Universities and higher education institutions play a critical role in promoting global and equitable access to health technologies…
but information on individual universities’ policies, public commitments, and actual contributions is fragmented and difficult to find.
UAEM’s University Access Dashboard collects and reports this information to build transparency and facilitate collaborations between student advocates and universities to advance more equitable technology licensing and R&D policies.
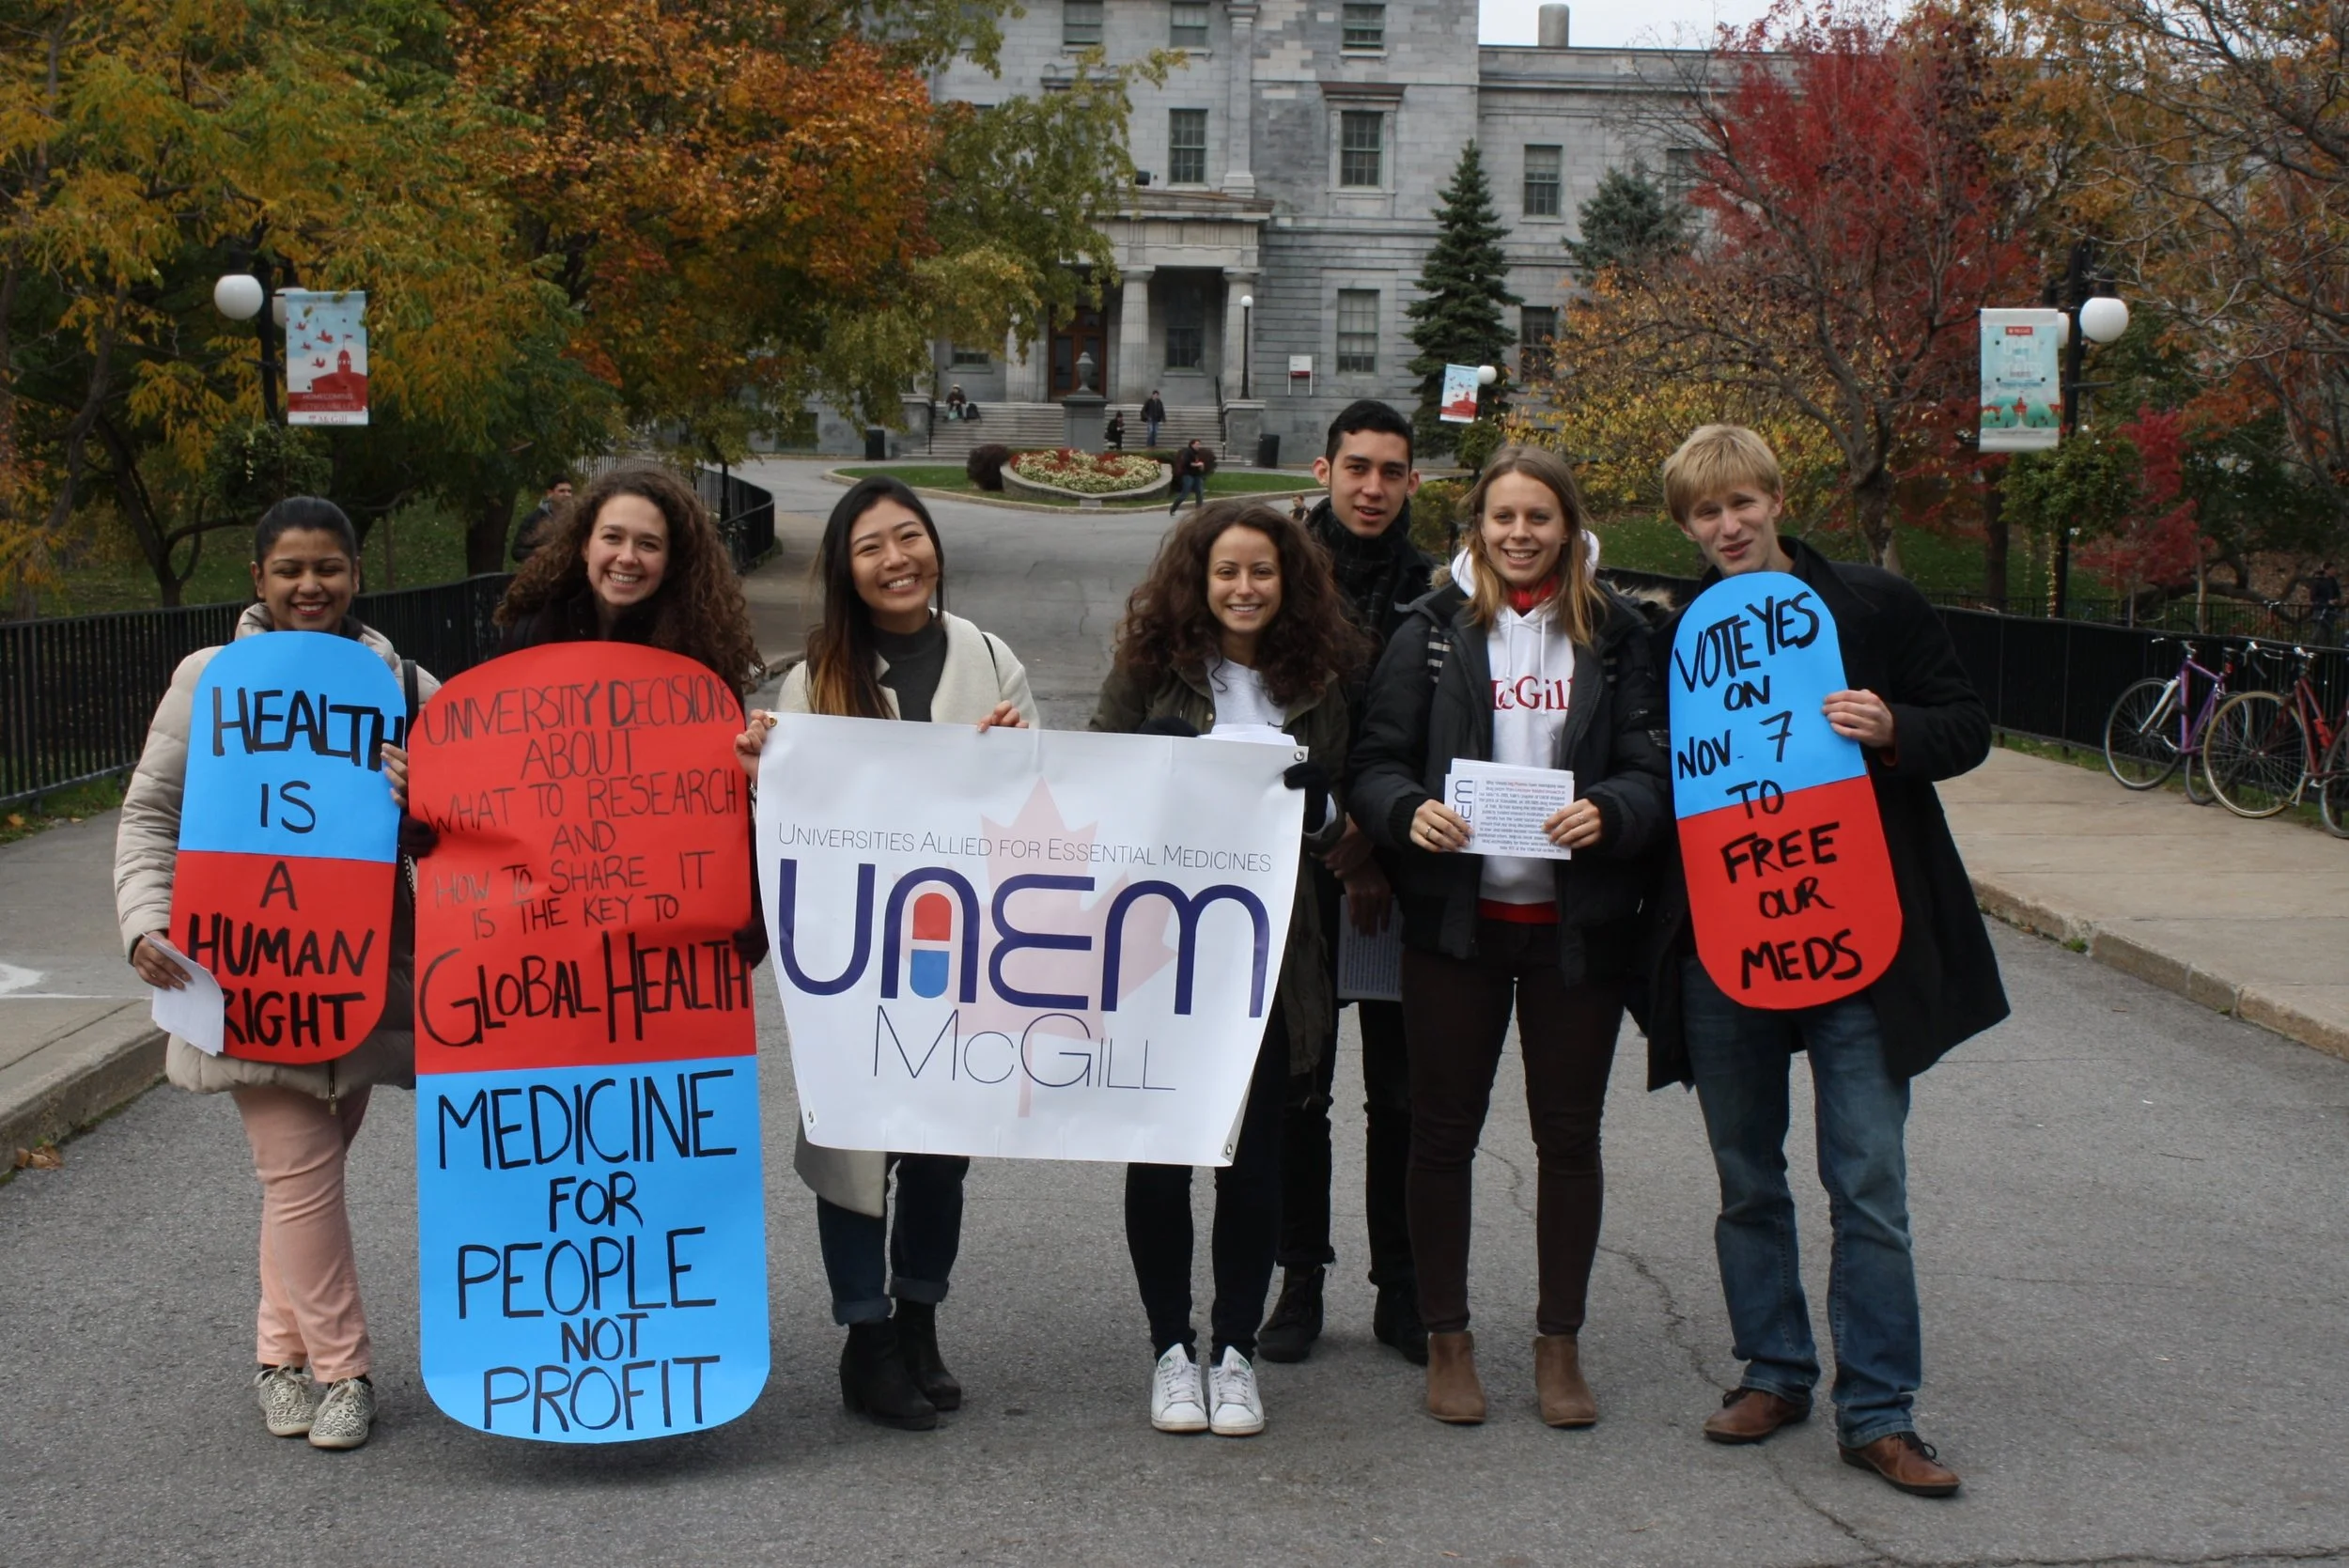
Our History
The UAEM University Access Dashboard is the next evolution of the University Report Card project.
One of UAEM’s oldest and most prominent projects, the University Report Card project began as a static, empirical snapshot of university contributions to equitable biomedical R&D across technology licensing, research funding, and global health education. Since its first iteration in 2013 to today, the project has evolved to better serve the core goals we’ve held from the start:
01
Create Rigorous Evidence
02
Build Transparency and Accountability
03
Facilitate Progress
What’s New
Integrating feedback on past iterations from access to medicines leaders, technology transfer offices, and advisors, this revamped format aims to highlight advancements in equitable biomedical R&D at universities and provide directions for increased social impact.
These are the changes we’re making to better achieve this goal:
A dynamic, living dashboard format
Moving from a static report to a live tool, the dashboard will be updated regularly to ensure information remains accurate with policy changes and innovation. Combined with ongoing data collection, this allows us to update the dashboard as TTOs share new updates.
Moving away from grades
Instead of letter grades, we’re implementing non-weighted index scores and rankings to make information easier to interpret and to prioritize constructive partnerships with key decision-makers.
Focused scope and prioritizing partnership
The dashboard narrows the focus, prioritizing licensing policies to facilitate university TTO participation in survey data collection.
We’ve also added metrics that will help TTOs understand their operations relative to comparable institutions, highlighting systemic patterns in the field.
Why These Changes?
The University Report Card, and now the University Access Dashboard, is first and foremost a tool to push for better practices, to advance access to life-saving medicines and health technologies for all. Amidst a rapidly changing and increasingly precarious landscape for university research, we’re changing our approach to:
Create a more cooperative atmosphere
Increase university response rates to receive more detailed responses and richer data
Provide more contextual information to inform future action